Posts

Coronavirus (COV-19) in NSW - Don't Panic

I was in a team meeting today and one of my co-workers said I shouldn't go to a conference in the city as there would be a chance I would get exposed to someone who had COV-19 and hence be put in quarantine. For me that sounds like a stretch, but lets do the math. At present there is 67 NSW confirmed cases of COV-19. This is after 50 days of exposure to the virus, so its not spreading rapidly for one.. But lets assume that 67 is not all the Coronavirus cases out there. As a benchmark, globally, South Korea seems the most aggressive country in regards to testing, so might be the true stat on how many cases out there. Based on a population of 51 million, after 50 days, they have 7513 cases. This means their infection daily rate is 2.94627E-06 Applying that daily rate to the NSW population (7.95 Million) and 50 days, and the NSW cases should be 1172 cases. Which means there are at least 1105 people out there who have Corona but have yet to be detected. So what are ...
NSW Bush Fires - Any Climate signal? Not really

Image
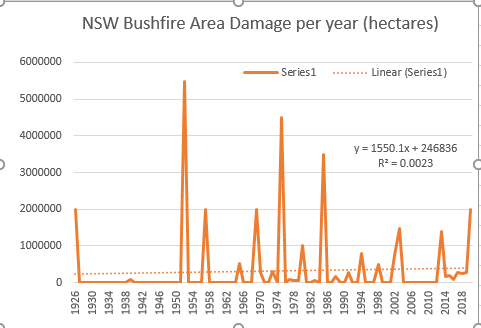
There seems to be a bit of hysteria about the NSW Bushfires at the moment. People starting to blame climate change as always for this years intense fire season. Not sure why. The IPCC has been pretty clear that there is only medium confidence that fire weather is increasing as a result of climate change. When you think that bush fires are dependent on a whole host of factors (fire weather, humidity, precipitation, human activity, wind) and only one of those is really degraded by climate change, it doesn't make sense. So I figured I would go to the stats and see if NSW bush fire activity has increased as a result of the increased temperatures. Using areas burnt as a proxy, and getting my data from the NSW RFS annual reports and NSW Parliament ( https://apo.org.au/sites/default/files/resource-files/2014/06/apo-nid40238-1132401.pdf ), I get the following data about bush fires since 1926. Just from the stats, it looks like the years fires are no unprecendented, and that the fi...

Does drought cause suicide - No statistical evidence to suggest that at all

Image
Every day in the newspapers and on talk back radio there are tales of suicide in rural Australia due to the drought. These claims seem to be accepted as facts, rather than being challenged. I would have thought that if drought was causing increased suicides we would see them in the ABS causes of death statistics in those drought years. So I pulled out my trusty stats, and, using Dubbo average rainfall from the BOM as a proxy for drought, looked for drought years. I have defined drought years as daily average rainfall that is 2 Standard Deviations from the 30 year average. This produced the following list of drought years, and the equivalent difference from the 30 year average suicide rate (which is 12 per 100,000 people). Suicide rate was from the ABS causes of death release So based on my analysis, I have drought years being 1982, 1997, 2002, 2006 and 2018. These years (googled) all appear to have been classified as drought. So if I run a regression on this to see what th...

Is WiseTech really that shit? Not really, but it is a predator.

Wise Tech has been in the news a bit after analysts have released some research saying it is overstating its income. Hard to really say that for mine. But there is no doubt there are some irregularities. Firstly, the capitalisation of R&D expenses...over the last 2 years Wise Tech has capitalised the R&D by around $80 million. If those expenses were expensed in the P&L instead, you would have reduced the NPAT over those 2 years from $101 million to $20 million. Meaning that the return on Equity would reduce from 9% to 1.8% with a dividend payout ration of around 15%, that means organic growth would only be around 1.5% Not much debt happening so the rest would be acquisition of businesses via share placements. And you do see that in the accounts. Share Capital has gone from $166 million in 2017 to $668 million in 2019. Then we also have the Goodwill impairment. Goodwill Balance at the moment is $600 million...basically 53% of total assets. That is high historically for I...

Happiness vs GDP

Image
Happy Countries are Rich Countries. I gathered the figures from the UN sustainability report. So every decrease in GDP Per Capita Rating, reduces the happiness rating by around 20%. Note any countries above the line are less happier than they should be. Those below are happier than they should be. Somalia is an interesting one.

Climate related Deaths in Australia - Heat deaths increasing, but Cold deaths reducing

Image
My favourite ABS release, Causes of death, was released today with 2018 figures. Always like having a look at what kills us. Anyway, with all this talk of Climate emergencies and extinction events or the like, it is always interesting if we are seeing any of that in the figures. Well, as you might expect, not really. Death rates over the last 20 years have actually reduced from 757 deaths per 100,000 in 1997 to 507.9 deaths per 100,000 in 2018. And the deaths from weather are tiny. Average yearly deaths from Excessive Cold (1997-2018) = 18 deaths Average yearly deaths from Excessive Heat (1997-2018) = 13 deaths It is true that Excessive Heat deaths are increasing, but at a rate of 0.54 deaths a year. So in 100 years, there will be an extra 54 deaths from heat. But to counter that, Excessive Cold deaths are decreasing at a rate of -0.23 deaths a year. So in 100 years, there will be 23 less deaths from Cold. So all up in 100 years, climate change will have caused a...

Drought in Tamworth NSW - Getting Worse? Not really

Image
With all the climate strike going on, people are pointing at the drought in North west NSW as a reason to de-carbonise due to Climate Change. So as always, I put my devils advocate hat on, downloaded some data from the BOM from a weather station close to Tamworth and had a look. So is the average rainfall in Tamworth worse as the climate has heated up? Not really. Been bad the last couple of years, and probably the worst drought since 1994, but overall, rainfall has actually increased since 1903 What about the number of rain free days? Actually decreasing since 1903 So this says more about preparation for drought than anything else. Maybe there should be more dams.